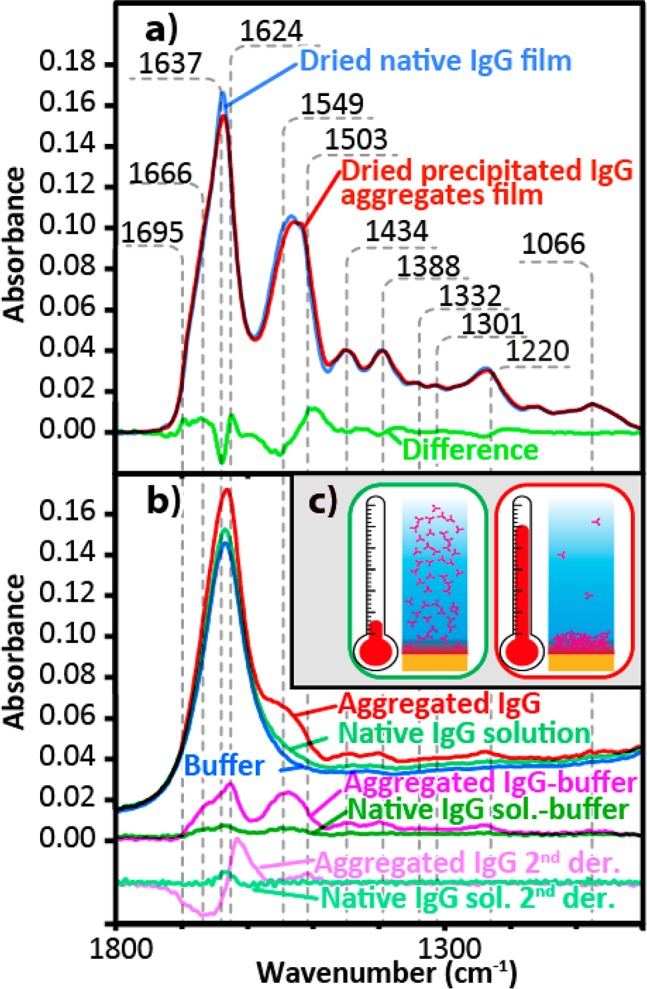
Figure 2.

(a) ATR-FT-IR spectra of cast native IgG dried film from a demineralized solution (blue), cast film from thermally induced aggregated IgG solution (red), and the difference between them (green). The dried native film was normalized for comparison using the average absorbance between 1300 and 1350 cm–1. (b) ATR-FT-IR spectra of the buffer (blue), 1 mg/mL native IgG solution (light green), precipitated aggregates induced by heating a 1 mg/mL IgG solution (red), difference between the native IgG solution and the buffer (dark green) and its second derivative (teal), and the difference between the aggregated IgG and the buffer (fuchsia) and its second derivative (pink). (c) Schematics illustrating the native IgG (green box) and the increased local concentration in the volume probed by ATR-FT-IR spectroscopy caused by heat induced protein aggregates precipitation (red box).
