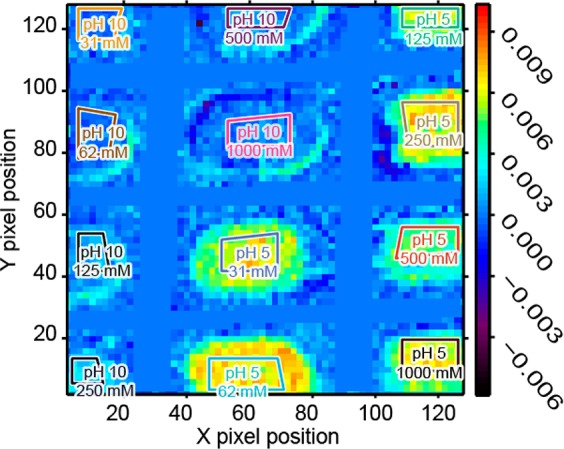
Figure 3.

ATR-FT-IR spectroscopic image generated using the amide II band area after 2000 s. All the images collected during the thermal stability assay are presented as a spectroscopic movie in the Supporting Information. The unit of the scale bar is integrated absorbance in cm–1. The polygons represent the integrated region of interest of each well. The field of view covered approximately 9.8 mm along the Y axis and 7.0 mm long the X axis.
