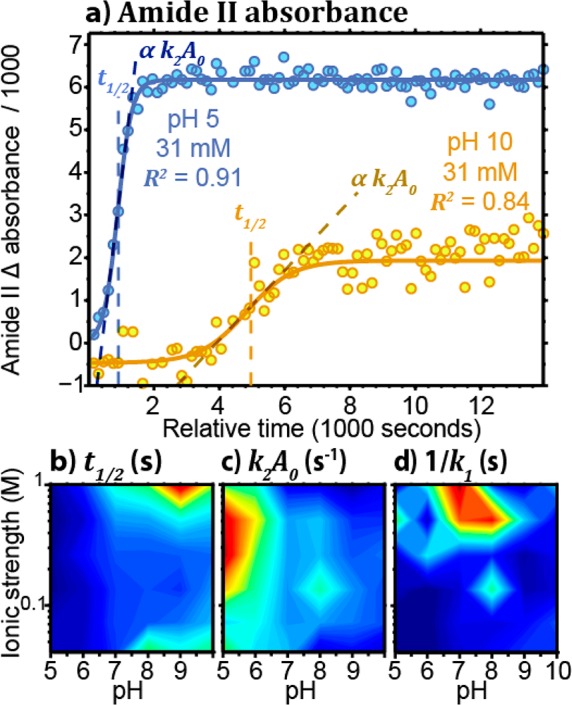
Figure 4.

(a) Integrated absorbance difference of the amide II band (1590–1495 cm–1) as a function of time for pH 5 (light blue) and 10 (dark orange) with 31 mM NaCl. The solid lines represent the result of the Finke-Watzky model fitting. (b) t1/2 as a function of the pH and ionic strength. (c) k2[A]0 as a function of the pH and ionic strength. (d) 1/k1 as a function of the pH and ionic strength.
