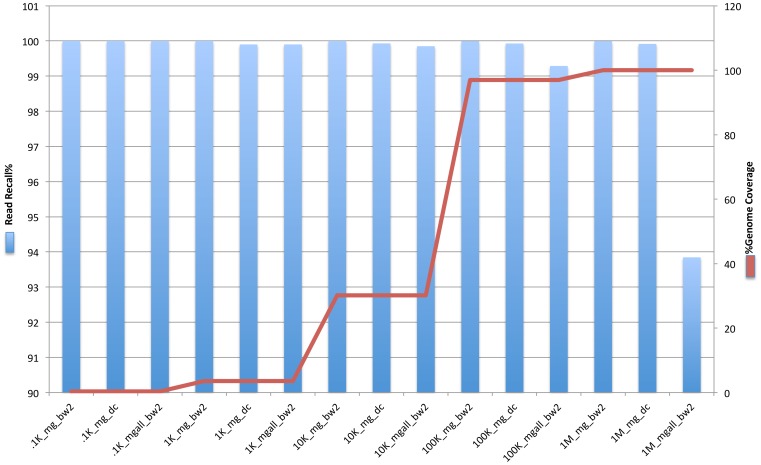
Figure 3. Effect of human filtration on percent genome coverage and read recall percentage of pathogen detection.
The legends of the figure are prefixed with the number of reads (0.1K = 100; 1K = 1000; 10K = 10000; 100K = 100000; 1M = 1000000) followed by mg_bw2 for only fast alignment feature of human read reduction; mg_dc for all features of human read reduction except data compression; mgall_bw2 for all features of human read reduction module).

