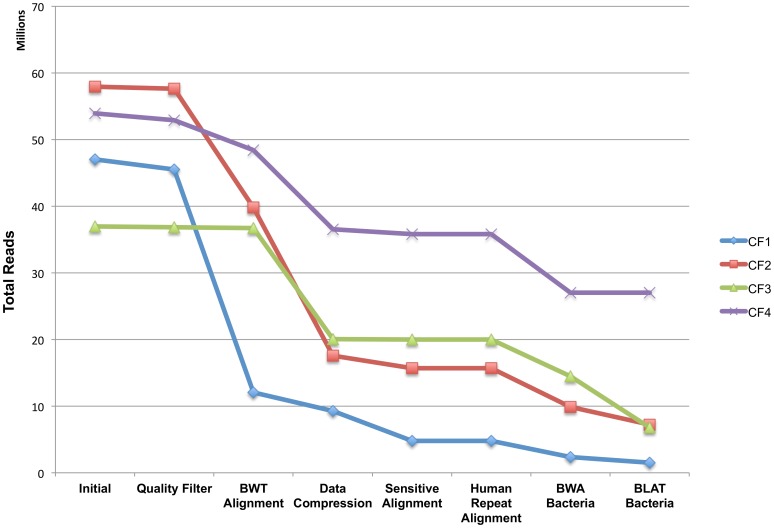
Figure 7. Sequential reduction of the metagenome reads for 4 clinical samples from cystic fibrosis patients.
Data points represent the remaining reads after each processing step of the pipeline. First six data points (Initial, Quality Filter, BWT Alignment, Data Compression, Sensitive Alignment, Human Repeat Alignment) represent the Human Read Reduction and BWA Bacteria and BLAT Bacteria represent Pathogen Detection against bacterial database.

