Figure 1. Trophic relationships between the main components of the food web in the Barents Sea ecosystem.
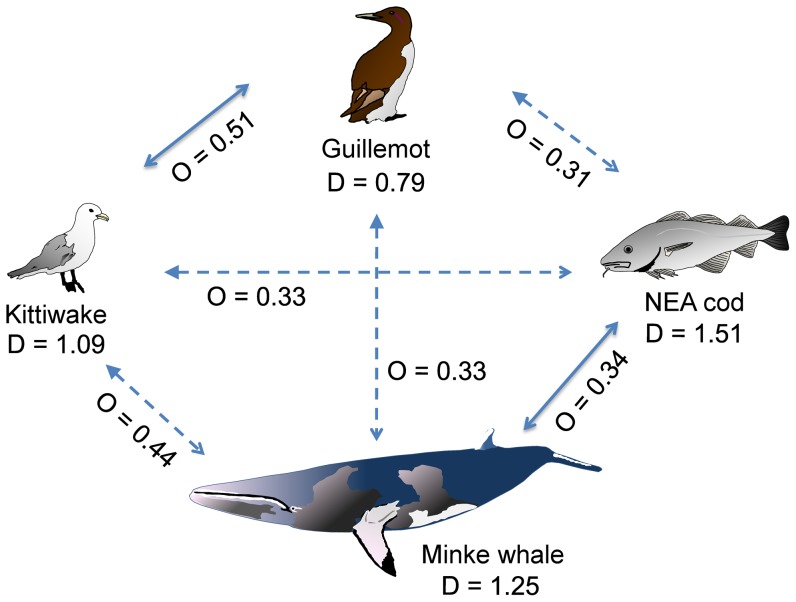
Average Schoeners' diet overlap index O for the five predator pairs studied and their respective Shannon-Wiener niche breadth D (see Table S1 in File S1). The significant relationship are given in plain arrows (Fig. 3, Table 3) The shape of the arrow head indicates the interpretation on how one species may affect another based on biomass [55]. Different arrow heads indicate unbalanced biomass between a predator pair (filled head indicates a potential stronger effect than open head).

