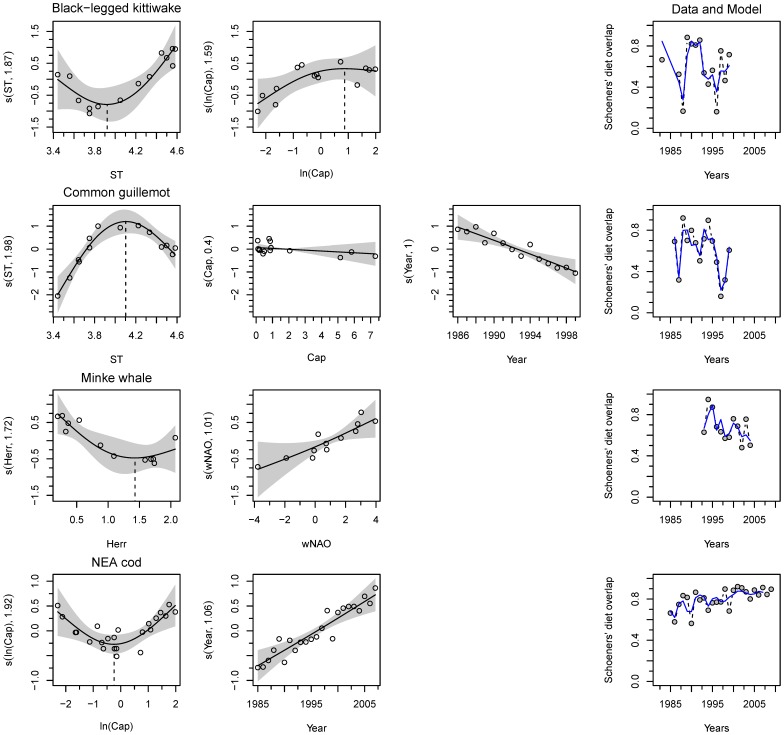
Figure 2. Intraspecific diet dynamics of the main predator species in the Barents Sea.
The generalized additive models (GAMs) are presented for each predator. For each plot, the x-axes show the covariate and the y-axes the partial effect that each covariate has on the response variable. The line is the smooth term effect of the considered covariate on the elasticity with the pointwise 95% confidence interval around the mean prediction (grey-shaded area). The dots are the partial residuals calculated by adding to the effect of the concerned covariate to the residuals, the model prediction at any given point is given by the sum of all partial effects plus a constant. When it applies, the dotted line locates the inflection point. Abbreviation are explained in Table 2 and the models in Table 3. Superimposed on the overlap data (grey filled dots) in the last column is the corresponding GAM prediction (plain line).

