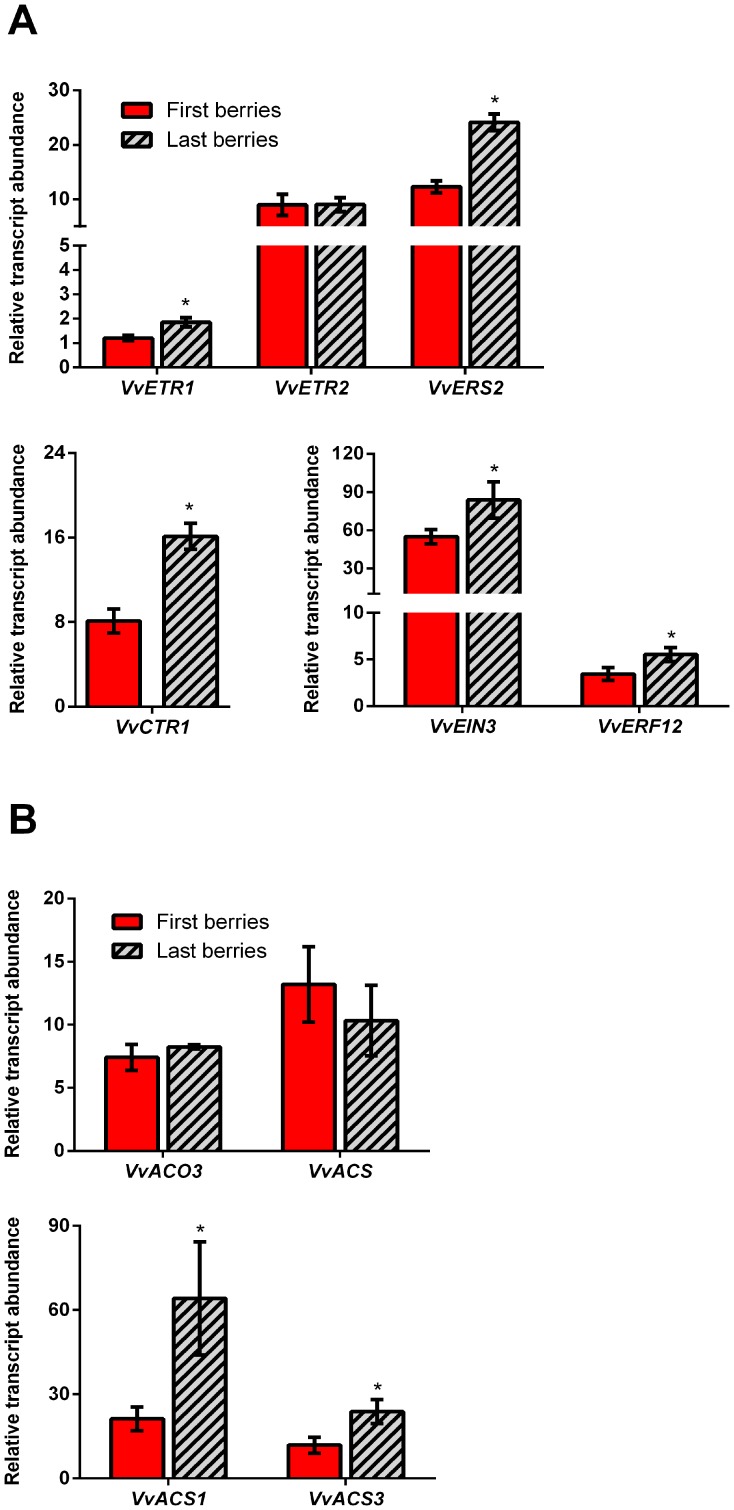
Figure 3. Transcript abundance of ethylene perception- and biosynthesis-related genes in “first berries” compared to “last berries”.
(A) Transcript abundance of VvETR1, VvETR2, VvERS2, VvCTR1, VvEIN3, VvERF12 genes assessed in first and last formed berries at 12 DAF. (B) Transcript abundance of VvACO3, VvACS, VvACS1 and VvACS3 assessed on first and last formed berries at 12 DAF. Transcript abundance is relative to the mean expression of the constitutive genes VvUBI1 and VvGPDH (for more details, see Material and Methods section). Significance was assessed using p value <0.05 (n = 3). Asterisk indicates that differences are significant between “first berries” and “last berries” for each gene analyzed. Error bars are STERR±.

