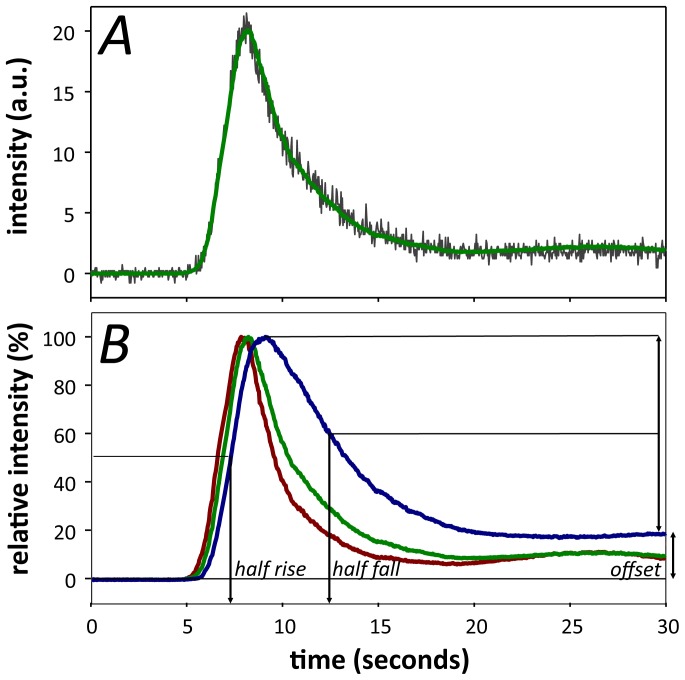
Figure 2. Video fluorescein dynamics in rat retinal vessels.
A. Representative intensity profile for an individual pixel before (grey trace) and after PCA (green trace). B. Representative normalized fluorescein intensity profile as a function of time in an artery (red), vein (blue) and capillary/choroid (green). Parameters used to analyze fluorescence profiles include the half-rise, half-fall and offset amplitude.

