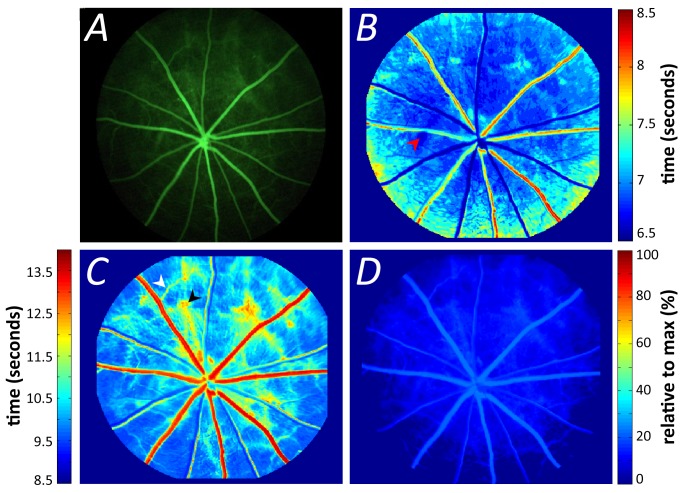
Figure 3. Pixel-by-pixel analysis of retinal video fluorescein angiography.
(A). The half-rise (B) and half-fall (C) parameters of the same retina. Warmer colors indicate increasing delay in the parameter. Arrowheads indicate areas of early choroidal filling (red), delayed fluorescein clearance due to secondary venules (white) and delayed choroidal clearance (black). The offset amplitude (D) expressed relative to maximum fluorescence (%).

