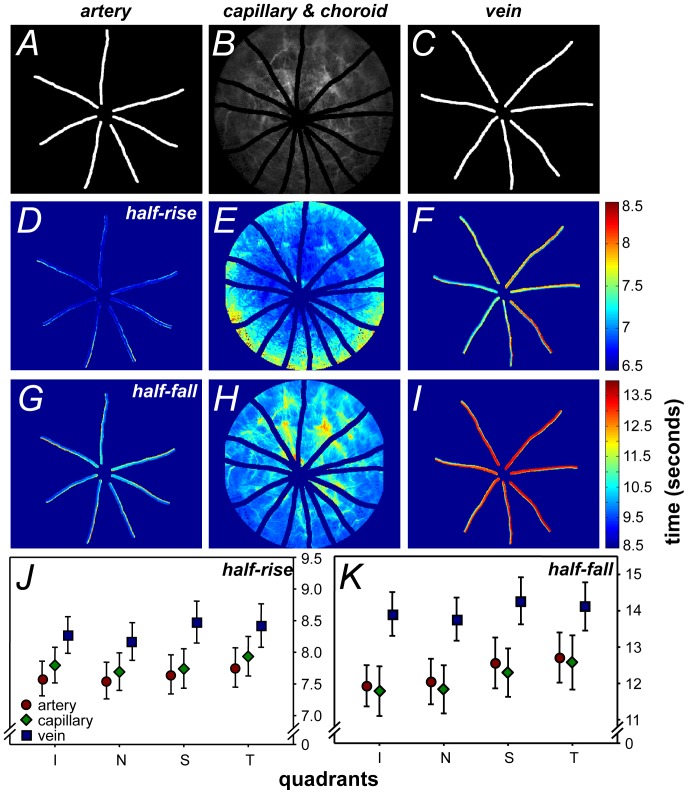
Figure 4. Segmentation of pixel-by-pixel analysis by blood vessel type.
A–C. Development of the mask via manual vessel tracing: artery, capillary/choroid and vein respectively. D–F. Representative images of the half-rise of each pixel. G–I. Representative images of the half-fall of each pixel. J–K. Group average of the half-rise and fall respectively, across the four quadrants of the retina shows fluorescein filling in the order of arteries, capillaries and veins followed by their decay. Significant differences in rise (p = 0.01) and fall (p<0.001) were found between vessel types (two-way ANOVA). Data shown is mean ±SEM, n = 14.

