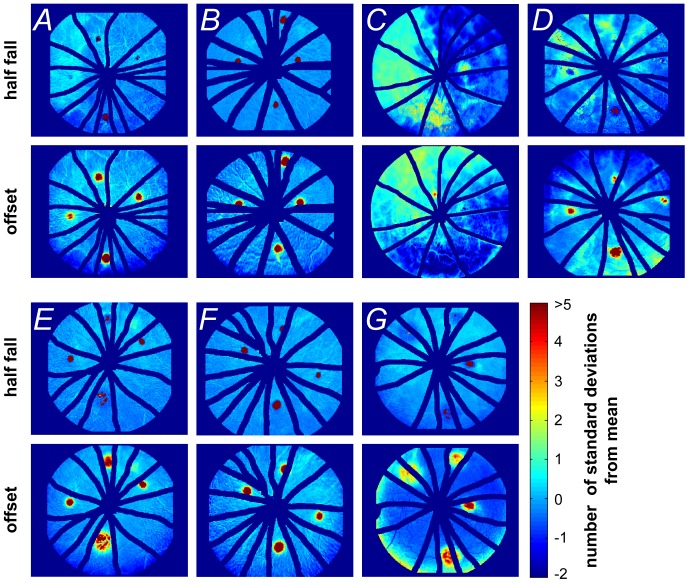
Figure 7. Half-fall and offset characteristics following laser injury in rat retina.
Retinal probability maps identifying the areas of abnormal half-fall (1st and 3rd rows) and offset amplitude (2nd and 4th rows) in relation to the number of standard deviations from the mean of the whole image, n = 7 eyes. Panels A to G represent each of the 7 laser-injured retinas.

