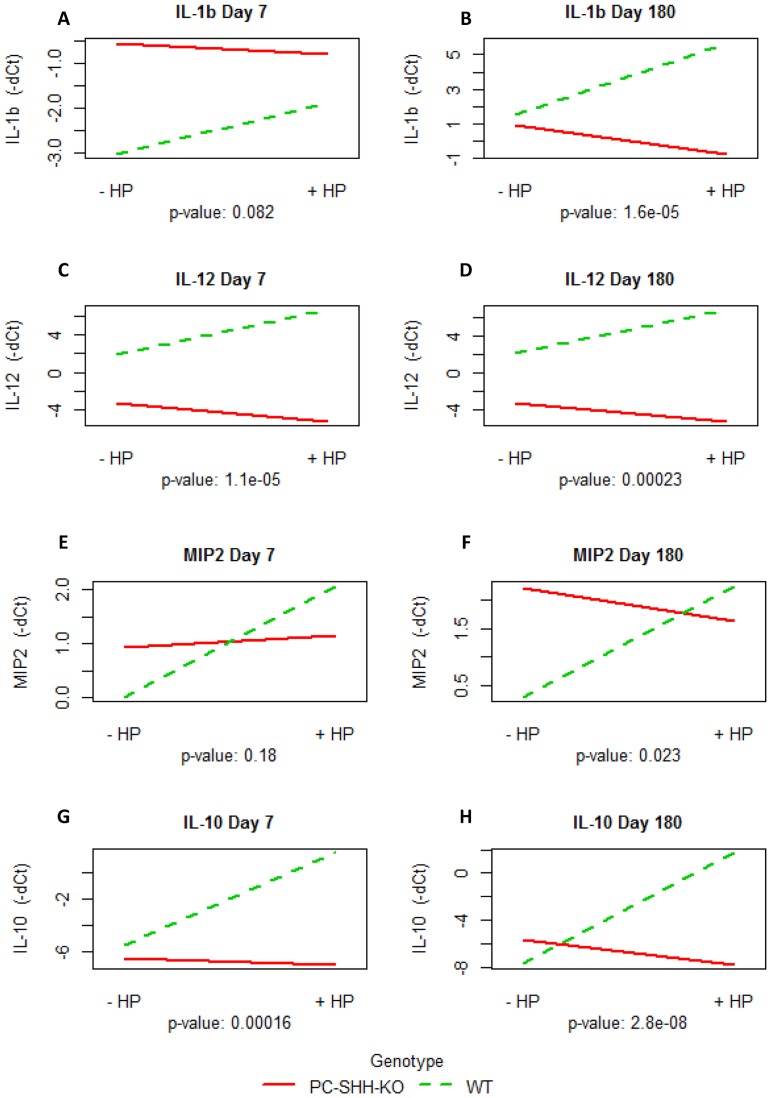
Figure 2. Interaction between infection status and genotype.
RNA was extracted from stomachs of uninfected (-HP) and H. pylori-infected (+HP) wild type (WT) and parietal cell specific SHH knock out (PC-SHH-KO) mice 7 and 180 days post-inoculation. Expression of genes was measured by qPCR and interaction test was performed. Parallel lines imply that H. pylori has same effect on gene's expression in WT and PC-SHHKO mice whereas intersecting or non-parallel lines indicate an interaction between genotype and infection. The graphs show interaction plot between infection status and genotype for (A) IL1β on day 7, (B) IL1β on day 180, (C) IL-12 on day 7, (D) IL-12 on day 180, (E) MIP-2 on day 7 (F) MIP-2 on day 180 (G) IL-10 on day 7 and (H) IL-10 on day 180. P-value for interaction between infection and genotype were calculated by two-way ANOVA test. Y-axis: mean of negative dCT value of cytokine, X-axis: infection status, trace-factor: genotype.

