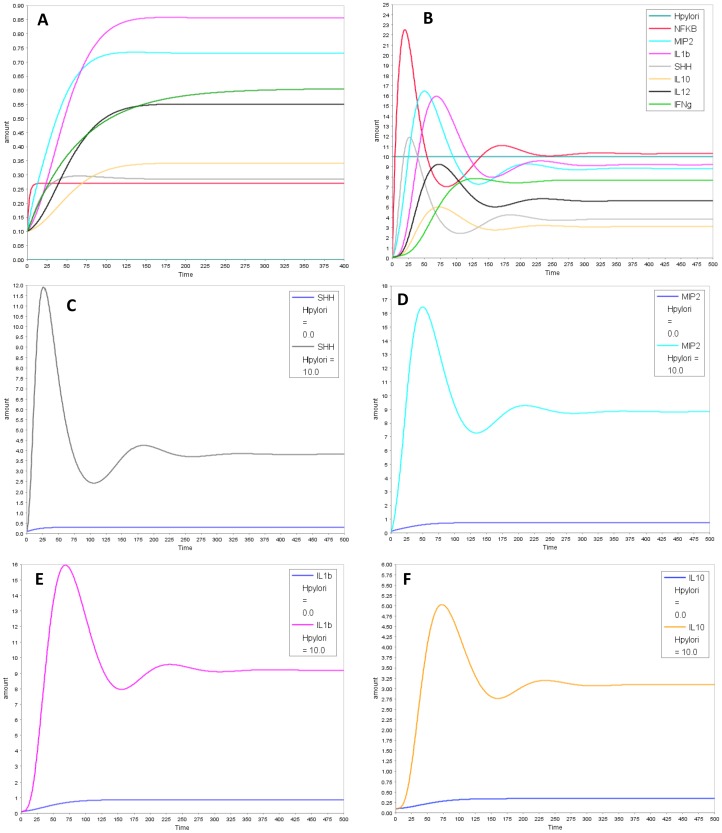
Figure 5. Temporal profiles of model species in uninfected and infected conditions.
Simulation results comparing temporal profiles of model species in (A) absence and (B) presence of H. pylori. Graph C–F show temporal profiles of (C) SHH (D) MIP-2 (E) IL-1β and (F) IL-10 in absence and presence of H. pylori.

