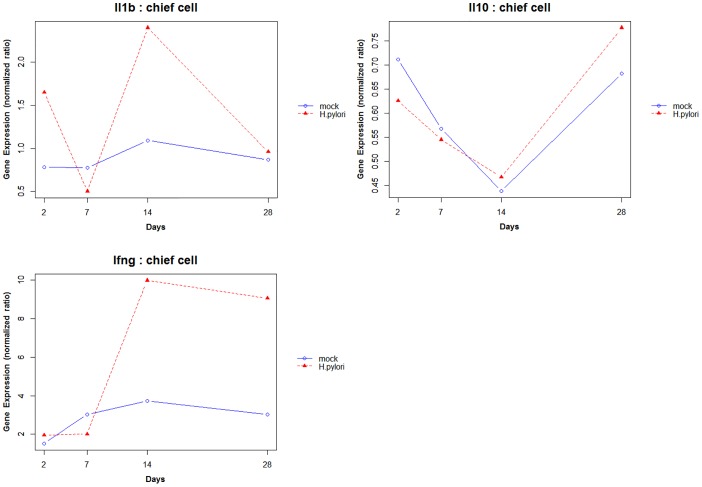
Figure 7. Trajectories of cytokines in mock-infected and H. pylori infected mice from GEO microarray dataset.
(A) IL-1β, (B) IL-10 and (C) IFNγ for day 2, 7, 14 and 28 from chief cell of mock-infected and H. pylori infected mice. The temporal profiles indicate that these cytokines potentially display a cyclic expression pattern in response to H. pylori infection.

