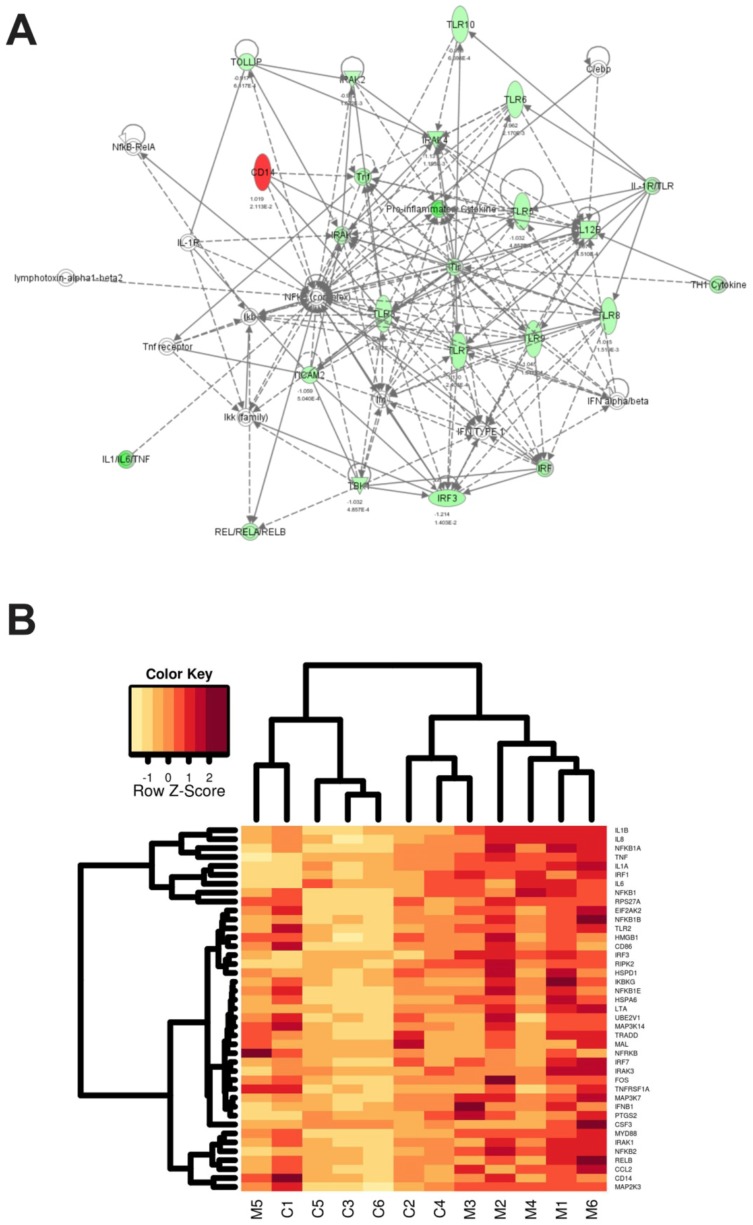
Figure 2. Functional linkage of gene expression patterns.
(A) Representation of gene expression patterns affected by the TLR4 Asp299Gly and Thr399Ile polymorphisms in unstimulated PBMCs using Ingenuity pathway analysis. A log2 ratio cutoff of 1 was set to focus on genes with greater than 2-fold differential regulation between the two groups. Intensity of colouring indicates the strength of the up-regulation (strong green, highly up-regulated in TLR4 wildtype subjects; strong red, highly upregulated in TLR4 polymorphic subjects; no colour indicates genes included to provide completeness of pathways). (B) Hierarchical clustering analysis of selected gene regulation by the TLR4 Asp299Gly and Thr399Ile polymorphisms in PBMCs following 2 hr LPS stimulation. All genes (n = 41) that following normalisation to housekeeper gene showed down-regulation in polymorphic samples compared to wildtype under LPS stimulation. The columns depict individual subjects (1–6), C = TLR4 wildtype subjects, M = TLR4 polymorphic (Asp299Gly and Thr399Ile) subjects. Each row represents a single gene, the key on LHS represents the range of expression level values from the data displayed in the heatmap.

