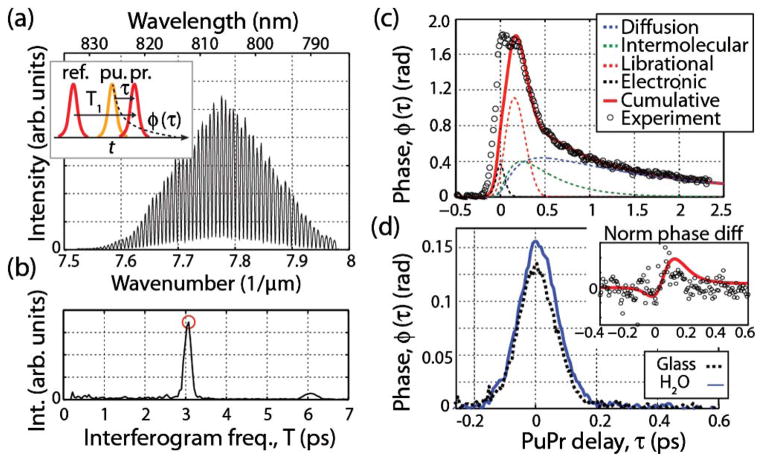
Fig. 1.
(a) Detected FD signal of two-field pulse train. The inset shows the pulse train where the two identical fields (ref. and probe) are delayed by T1 = 3 ps and the pump arrives after ref. to produce the temporal nonlinear dynamics. (b) Absolute value of the FT of (a). The phase at the peak (red circle) reveals the OKE dynamics. (c) Measured CS2 OKE dynamics along with the expected response. (d) Measured OKE dynamics of water and glass. The inset shows the experimental (circles) and expected (red line) difference after normalizing.

