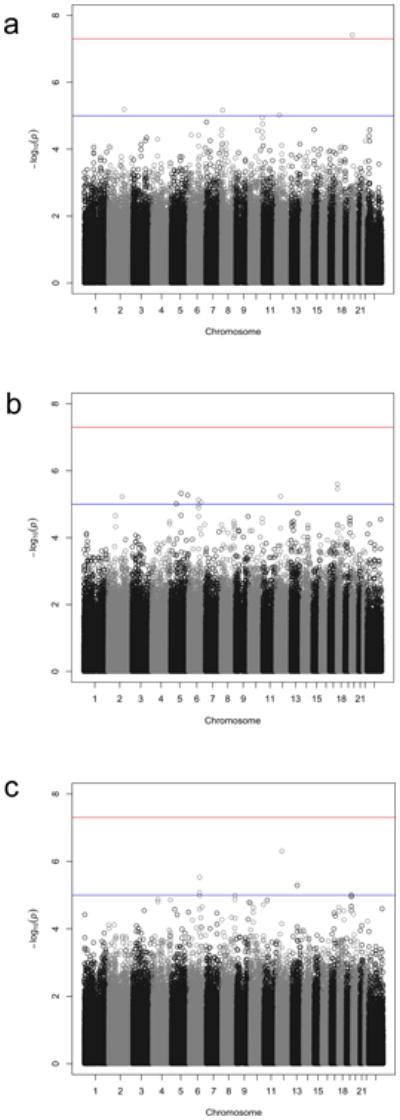
Figure 2. Manhattan Plots for: (a) Trio, (b) Case-Control and, (c) Combined Trio-Case-Control Samples.

Manhattan plots of all genotyped single-nucleotide polymorphisms (SNPs) for (a) trio samples; (b) case-control samples; and (c) combined trio-case-control samples. Red and blue lines indicate significance thresholds of 5 ×10⁻⁸ and 1 × 10⁻⁵, respectively.
