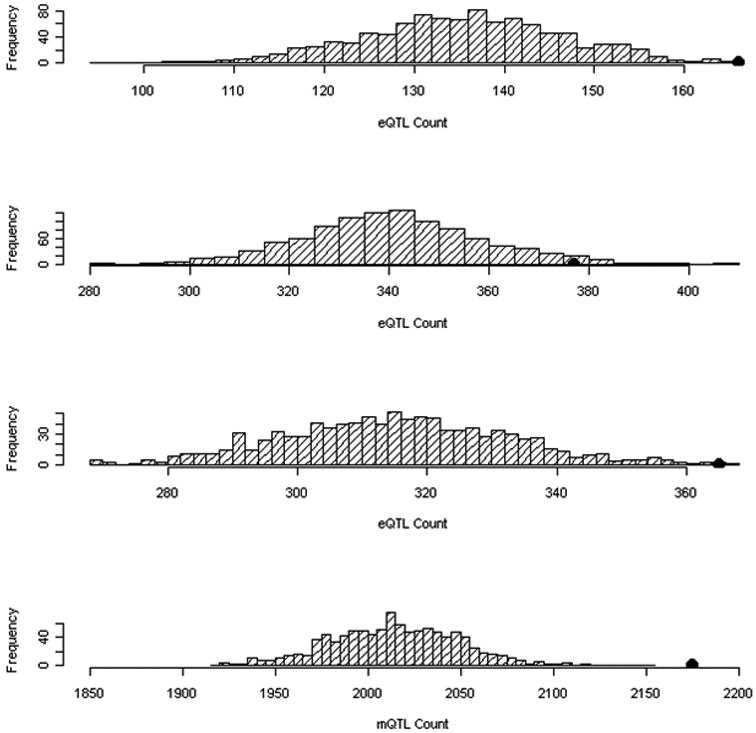
Figure 4. Enrichment analyses for Quantitative Trait Loci (QTLs) among GWAS Variants with p<0.01.

Enrichment of (a) frontal lobe expression QTLs (p=0.001), (b) cerebellum expression QTLs (p=0.033), (c) parietal lobe expression QTLs (p=0.003), and (d) methylation QTLs (p<0.001) among GWAS SNPs with p<0.01 (N=5321). Distribution of the count of QTLs in 1,000 simulations are displayed, each matching the MAF distribution of the OCD–associated SNPs. The black dot identifies the observed eQTL or mQTL count in the OCD susceptibility–associated SNPs.
