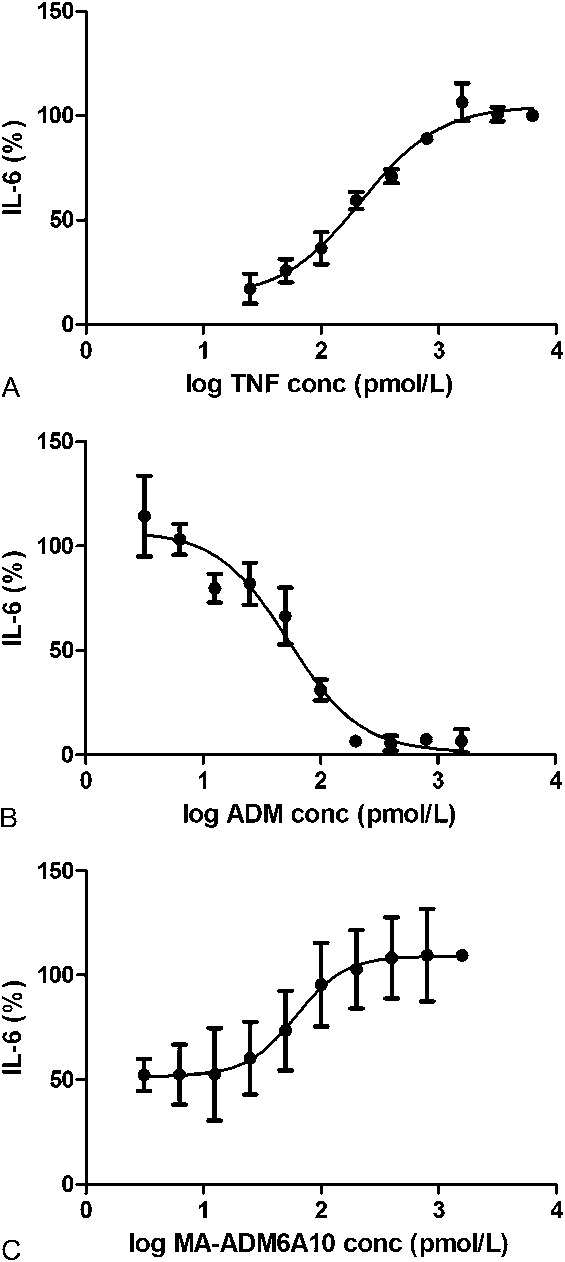
FIGURE 2.

Dose–response curve of TNF (A), ADM (B), and MA-ADM6A10 (C) in CBA. HT1080 cells were incubated with TNF. A, IL-6 was measured and expressed as log TNF concentration versus IL-6 response (mean ± SD, n = 2). B, Inhibition of TNF by ADM was determined using 7.5 ng/mL TNF (441.2 pmol/L) and ADM (0–240 ng/mL) (mean ± SD, n = 2). C, To determine the inhibitory effect of MA-ADM6A10, different doses (0–240 ng/mL) of MA-ADM6A10 were added to sera supplemented with 7.5 ng/mL TNF (441.2 pmol/L) and 15 ng/mL ADM (100 pmol/L) (mean ± SD, n = 5).
