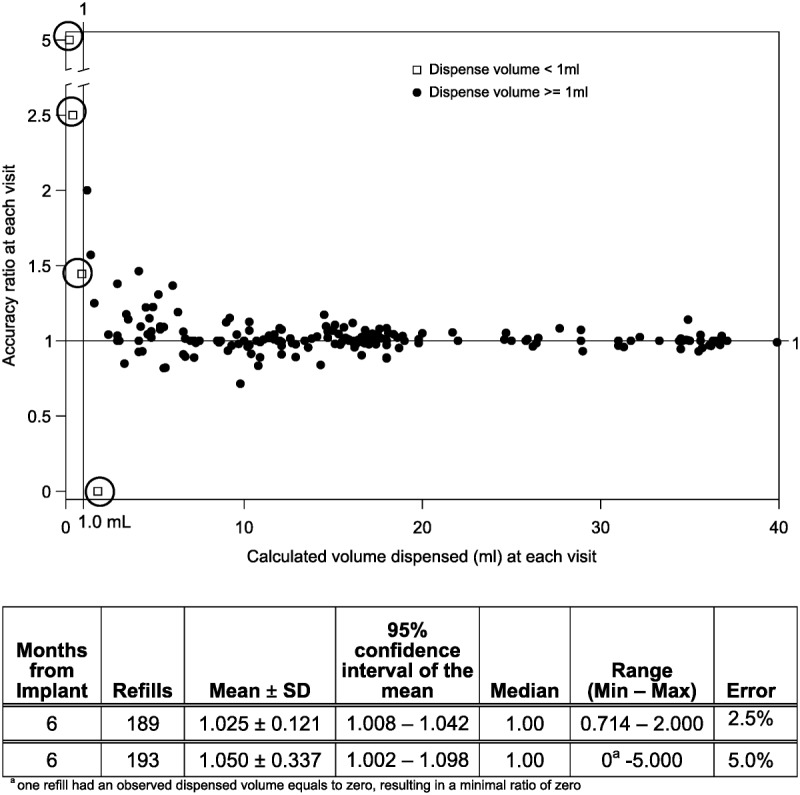
FIGURE 3.

Per-refill accuracy ratios, from implant to 6 months after implantation (n = 193 refills). Each refill visit’s data were used to calculate a ratio of observed volume dispensed to programmer-calculated amount dispensed. The individual ratios are plotted and summarized in 2 ways, including the circled outlier values (193 refills) and excluding them (189 refills).
