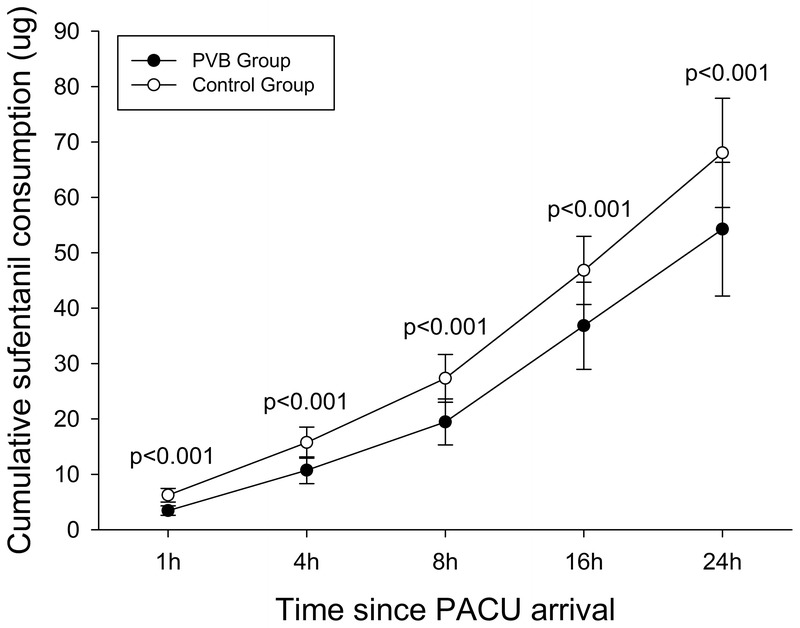
FIGURE 2.

Cumulative sufentanil consumption in the first 24 postoperative hours. Data are presented as mean and SD. Differences of cumulative sufentanil consumption at each time point between the 2 groups were compared with repeated-measures ANOVA followed by Student t test. The Bonferroni correction was performed on the raw P value. Patients in the paravertebral group consumed less sufentanil than did patients in the control group at each time point.
