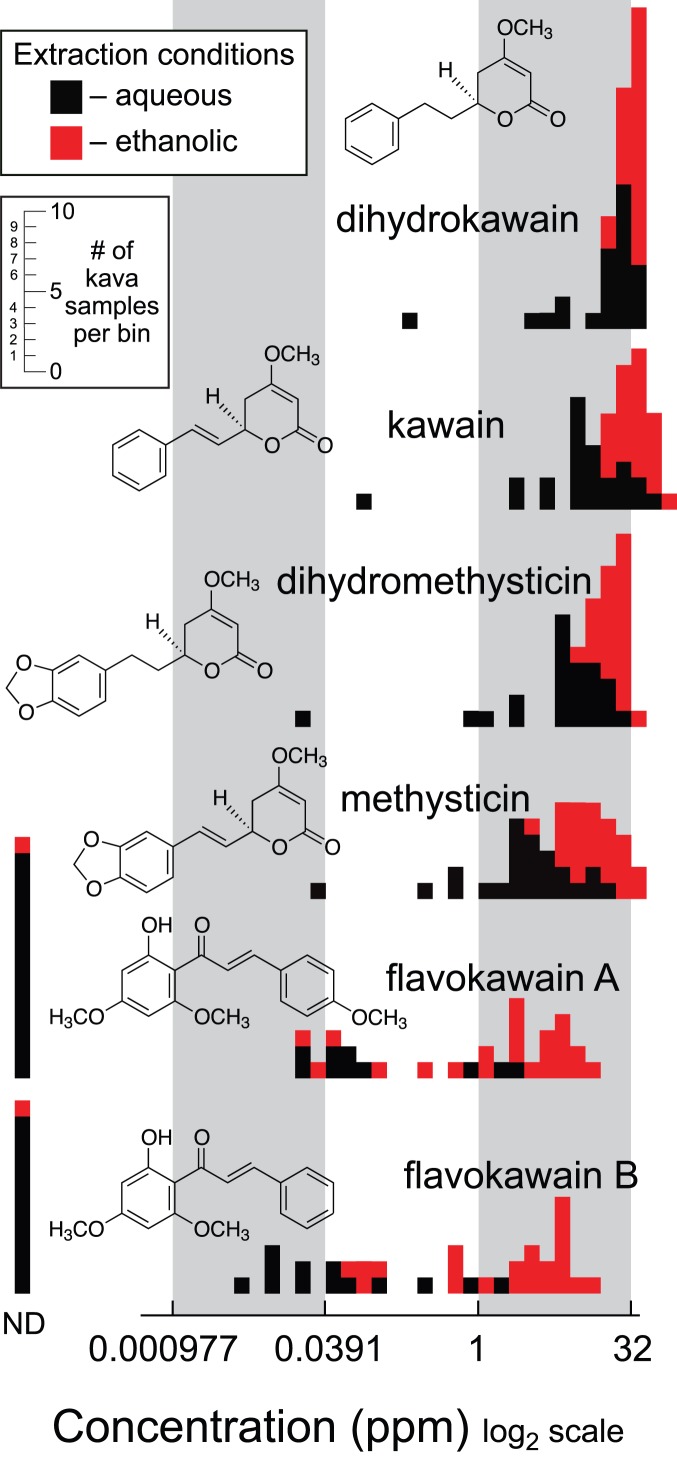
Figure 1. Histograms showing the distribution of concentrations of compounds found in commercial kava preparations.
Kava samples were extracted with both 100% water (black) and 95% ethanol (red). The six compounds shown were quantified in each extract by LC-MS and the resulting concentrations in part per million are displayed histogramatically. Distributions were normalized by display on a log2 scale. The inset y-axis scale indicates the numbers of kava samples in each bin. Measurements designated as not detected (ND) were below the limits of detection (LOD (s/n<3) for each analysis, which were typically 0.0005 to 0.001 ppm depending on variation in signal to noise from sample to sample.

