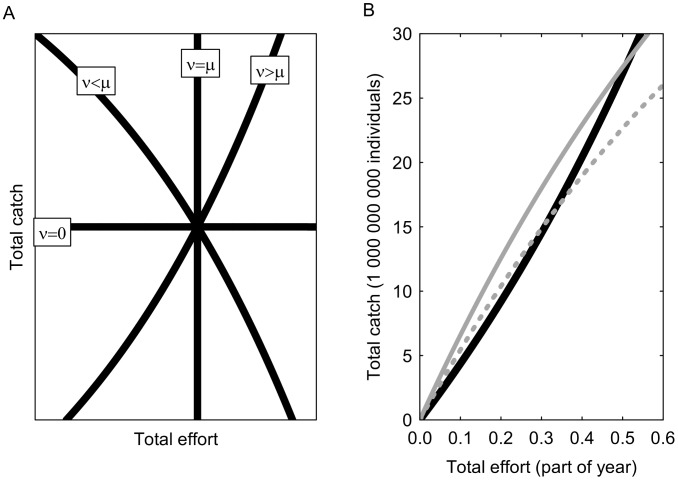
Figure 1.
(A) Bayesian regulation curves indicating the combined total catch (y-axis) and total effort (x-axis) when fishing should be terminated for the season. The curves are given by equation 1 when r is set to the target number of fish, and solved for total catch. Hence, the curves show when the fishery target is achieved in catch-effort space, given by the ratio of variance (v) to mean stock size (µ). There are four qualitative cases of the v-µ ratio: when the ratio is zero, the fishery is regulated by catch only because there is no uncertainty around the mean. When the ratio equals 1, regulation is by effort only. Apart from these special cases, the fishery should be regulated by both catch and effort. If the variance is lower than the mean, the posterior mean will decrease with accumulating catches and effort. If the variance is higher than the mean, the posterior mean will increase with increasing catches but decrease with effort. These effects can be deduced from analyzing equation 1. (B) Here the solid curve denotes the Bayesian regulation when v>µ, which is determined prior to the fishing season (see Methods). The grey curves are idealized trajectories of how cumulative catch and effort develops from the origin during the fishing season. When the trajectories cross the regulation curve, the Bayesian posterior is on target, and the fishery should be closed for the season. The hatched grey line indicates when the initial stock size is at the prior mean (µ), the solid grey line when the stock size is at the mean plus one standard deviation (see F MSY -analysis). The BR thus allows larger catches when the stock size has been underestimated, and vice versa.

