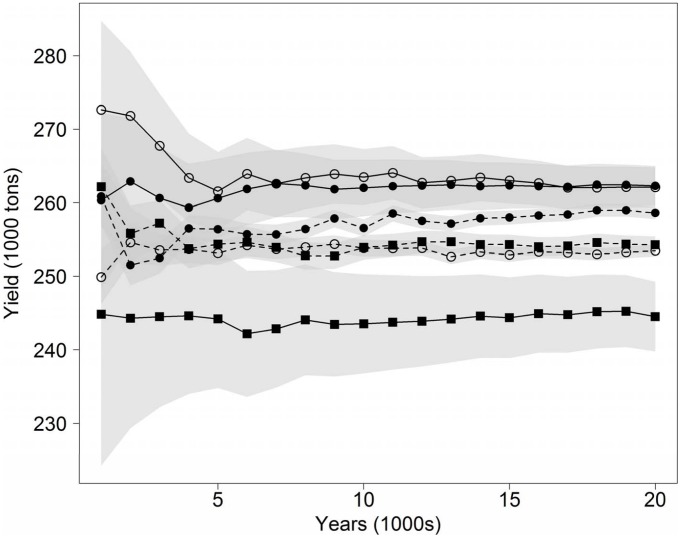
Figure 3. Average yields and confidence intervals as functions of increasing length of simulation in years.
Filled symbols denote supervised and open symbols unsupervised harvest control. Squares denote CR and circles BR. Solid lines denote N-target management whereas hatched lines denote F-targeted management.

