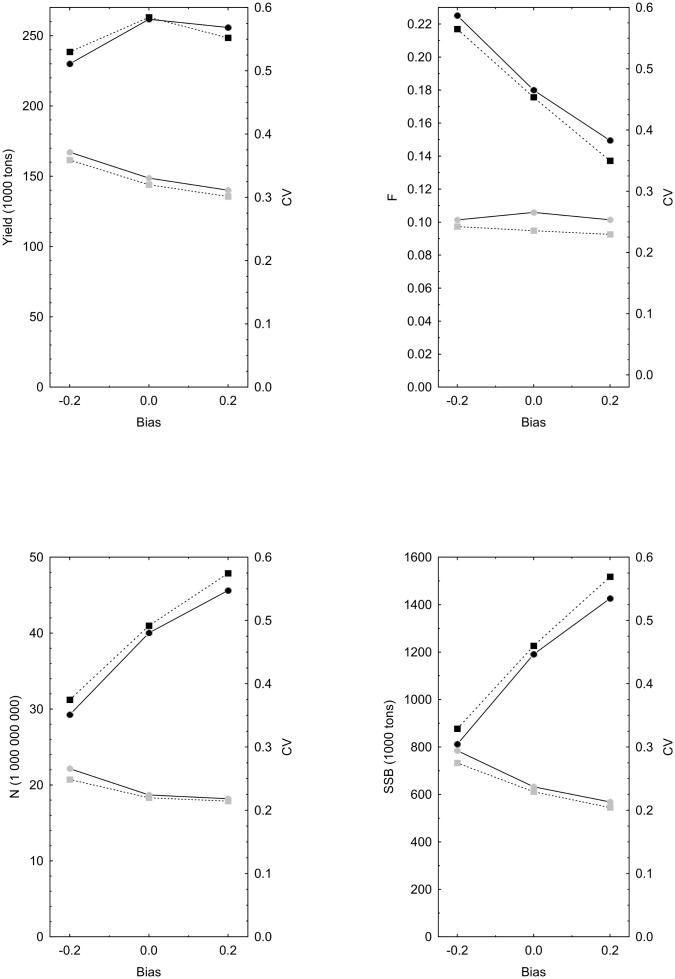
Figure 7. A comparison of yield, fishing mortality (F), post-harvest stock size (N’) and spawning stock biomass (SSB) when random errors of the same CV are applied to both the stock size assessment (µ) and the estimated catchability parameter ( ).
).
Relative positive and negative biases applied to  and µ are denoted on the x-axis. Circles denote results from F-targeted unsupervised BR and squares F-targeted supervised CR. Black symbols denote the value (left axis) and grey symbols the CV of the effect-variable (right axis).

