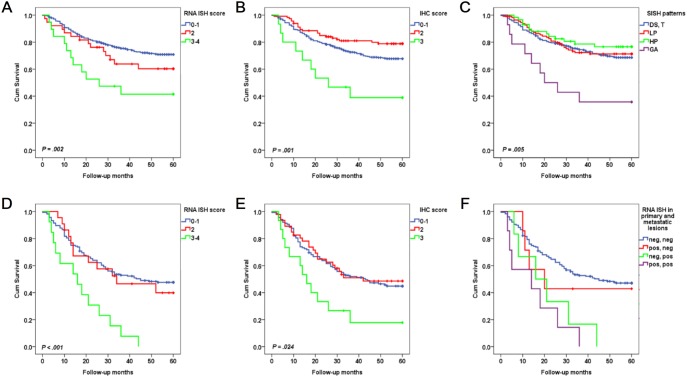
Figure 3. Kaplan-Meier curves for overall survival (OS) according to MET status.
In 535 primary GC, (A) high-MET mRNA was associated with poor OS compared to low-MET mRNA (P = .002), (B) MET overexpression was associated with poor OS compared to no overexpression (P = .001), and (C) MET gene amplification was associated with poor OS compared to no amplification (P = .005). In 199 metastatic lymph nodes, (D) high-MET mRNA was associated with poor OS compared to low-MET mRNA (P<.001), and (E) MET overexpression was associated with poor OS compared to no overexpression (P = .024). (F) In 199 matched primary tumors and metastatic LNs, concordantly positive and positive conversion groups were associated with poor OS compared to concordantly negative group (concordantly negative vs. negative conversion, P = .640; concordantly negative vs. positive conversion, P = .011; concordantly negative vs. concordantly positive, P<.001; concordantly positive vs. negative conversion, P = .137; concordantly positive vs. positive conversion, P = .382; negative conversion vs. positive conversion, P = .260).

