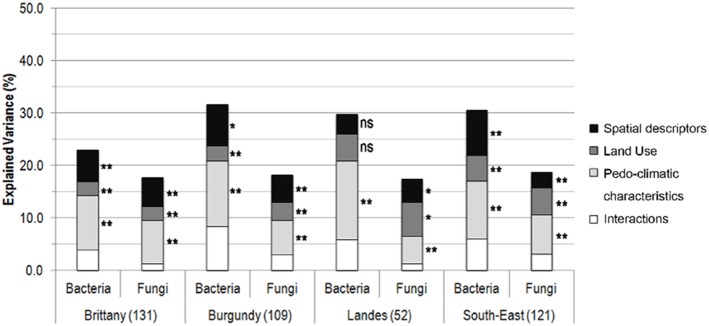
Figure 3. Variance partitioning of bacterial and fungal community composition.

The number indicated in brackets corresponds to the number of samples for the region. Significance levels: ns: not significant; P<0.05: *; P<0.01: **, P<0.001: ***.

The number indicated in brackets corresponds to the number of samples for the region. Significance levels: ns: not significant; P<0.05: *; P<0.01: **, P<0.001: ***.