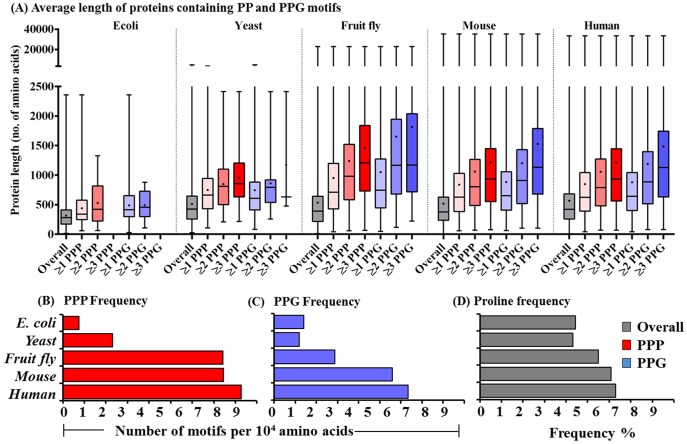
Figure 3. The distribution of protein lengths and the frequencies of PPP, PPG and proline in proteomes of the five species.
(A) Protein length is expressed as the number of amino acid residues per protein. The distribution of protein lengths of total proteins and of those containing ≥1, ≥2, and ≥3 PPP or PPG units are represented by box and whisker plot. The boxes indicate the 25th and 75th percentile; horizontal line in the box is plotted at the median and the whiskers ranges from minimum length to maximum. The mean is shown by a black dot inside the boxes. Frequencies of (B) PPP, (C) PPG and (D) proline were calculated by division of total number of PPP or PPG units and of proline with total amino acid numbers in each proteome and the actual values are listed in Table 2.

