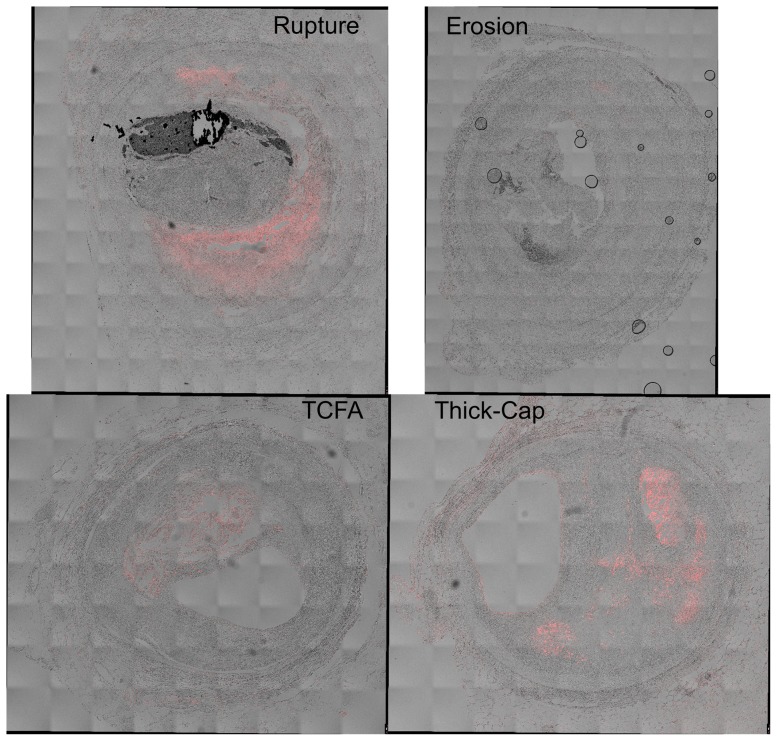
Figure 9. Representative histology images of TUNEL staining.
Serial sections of the lesions shown in Figures 1 and 2 were stained for apoptosis using the TUNEL approach (red staining), and differential interference contrast (DIC) is shown for reference. Regions containing coverslip bubbles such as that seen in the erosion specimen were manually masked and excluded from final analysis.

