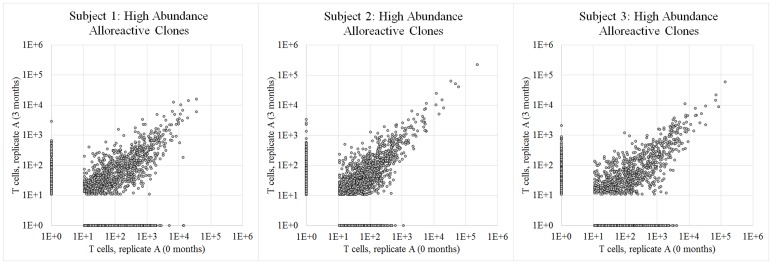
Figure 4. T cell clonal frequency among temporal replicates of mixed lymphocyte culture.
Above are three scatter plots showing the number of T cells bearing each unique CDR3 sequence in replicate mixed lymphocyte culture experiments performed three months apart on each of three pairs of healthy adult subjects. Considering only T cell clones previously observed in a pre-MLR T cell sample from each time-point and enriched at least ten-fold after mixed lymphocyte culture, each point represents a unique T cell clone and points are plotted at (# of observed T cells +1) so that clones unobserved in one sample are plotted on the axes.

