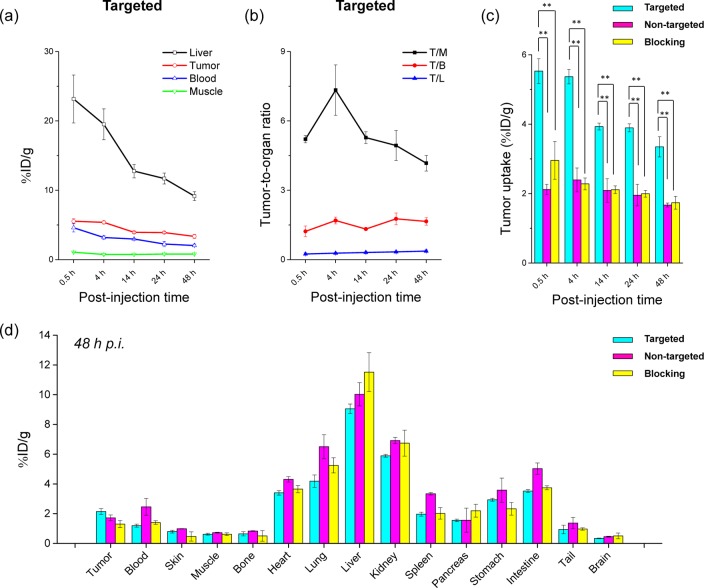
Figure 6.
Quantitative analysis of the PET data. (a) Time–activity curve of the liver, 4T1 tumor, blood, and muscle upon iv injection of 64Cu-MSN-800CW-TRC105(Fab) (targeted group, n = 3). (b) Time–activity curve of tumor-to-muscle (T/M), tumor-to-blood (T/B), and tumor-to-liver (T/L) ratios from the same targeted group (n = 3). (c) Comparison of 4T1 tumor uptake among the three groups. The differences between 4T1 tumor uptake of 64Cu-MSN-800CW-TRC105(Fab) and the two control groups were statistically significant (**P < 0.01) in all cases. (d) Biodistribution of three groups in 4T1 tumor-bearing mice at the end of the PET scans at 48 h pi (n = 3).

