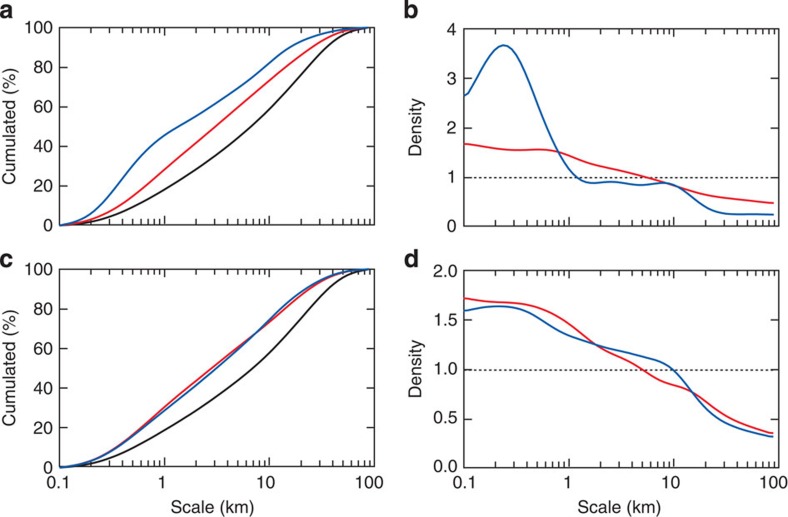
Figure 3. Cumulative biovolume/biomass within DS space-scale structures.
(a) Standardized cumulative downward DS (black), and zooplankton (red) and fish (blue) biomass embedded in the corresponding space-scale structures during the day (c depicts nighttime data); grain scale: 40 m. (b) Ratio between the density function of the cumulative embedded zooplankton (red) and fish (blue) biomasses and the density function of cumulative DS (d for nighttime).

