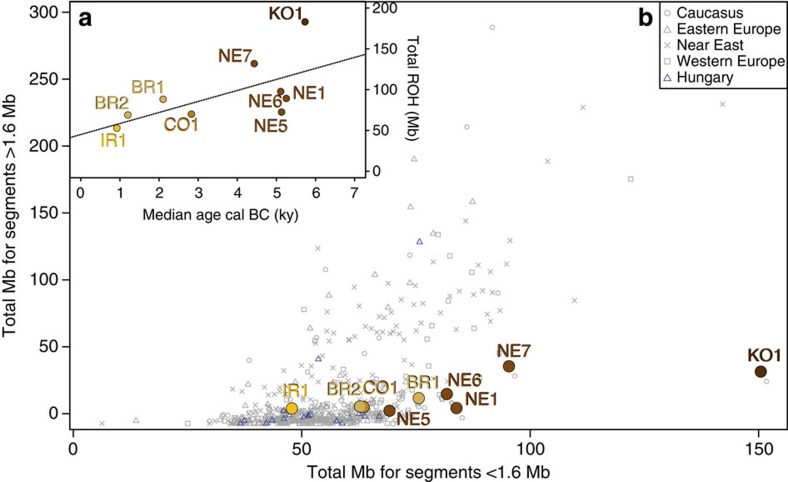
Figure 5. Short versus long ROH.
(a) Regression between age (median value, cal. BC) and total Mb of run of homozygosity (r2=0.4042, P-value=0.06573). (b) Short (<1.6 Mb) versus long (>1.6 Mb) runs of homozygosity based on 151,407 autosomal SNPs for the 9 ancient Hungarian samples compared with European, Near Eastern and Caucasian populations (Supplementary Methods).

