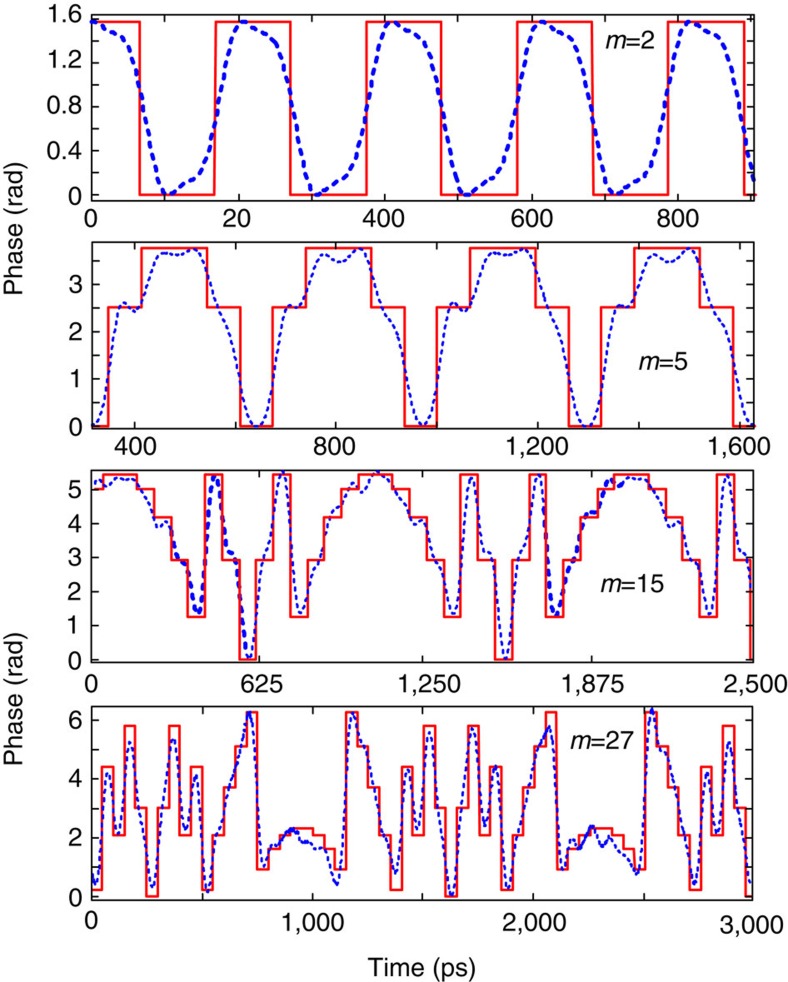
Figure 2. Experimental-prescribed phase-modulation profiles.
Temporal phase-modulation patterns required for amplification factors m=2, 5, 15 and 27, as determined by the Talbot carpet. The dashed blue curves show the experimental traces generated from an electronic arbitrary waveform generator (7.5-GHz analogue bandwidth), as measured by an electrical sampling oscilloscope (40-GHz bandwidth), whereas the solid red curves show the ideal phase traces. For comparison, the experimentally measured electrical traces have been normalized to match the ideal phase profiles.

