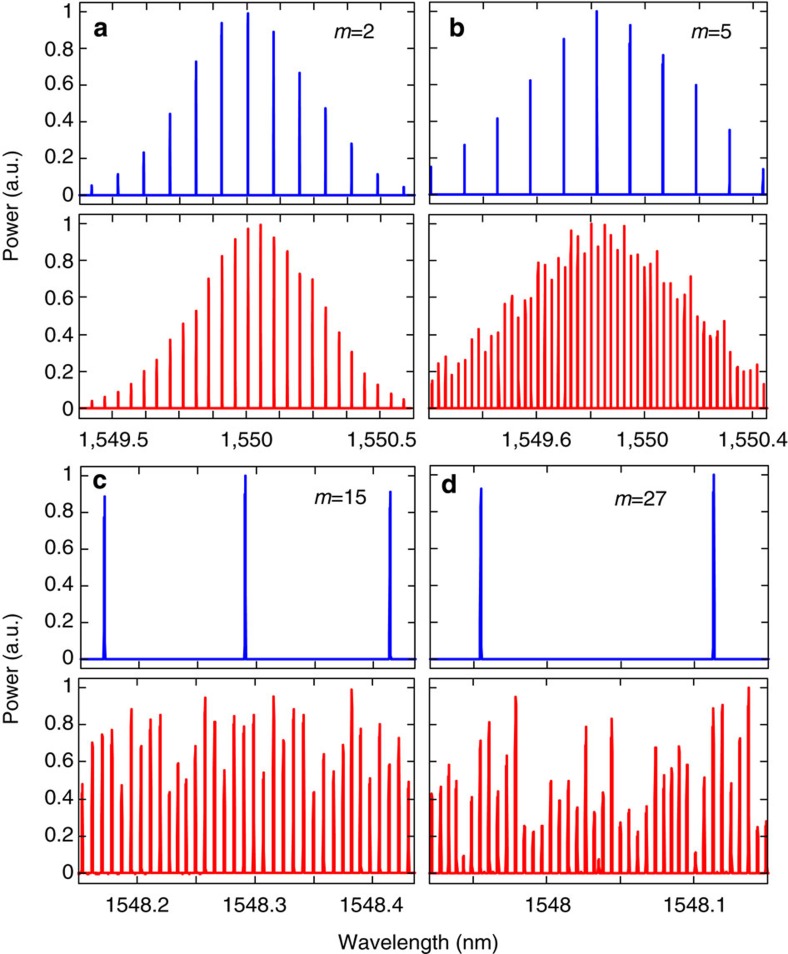
Figure 3. Measured optical spectra of the optical pulse trains.
Optical spectra of the optical pulse trains recorded with a high-resolution (20-MHz) optical spectrum analyzer after phase modulation with the phase modulator turned off (blue, top plot) and with the phase modulator turned on (red, bottom plot), demonstrating the expected decrease in the frequency comb spacing by factors of (a) m=2, (b) m=5, (c) m=15 and (d) m=27, respectively.

