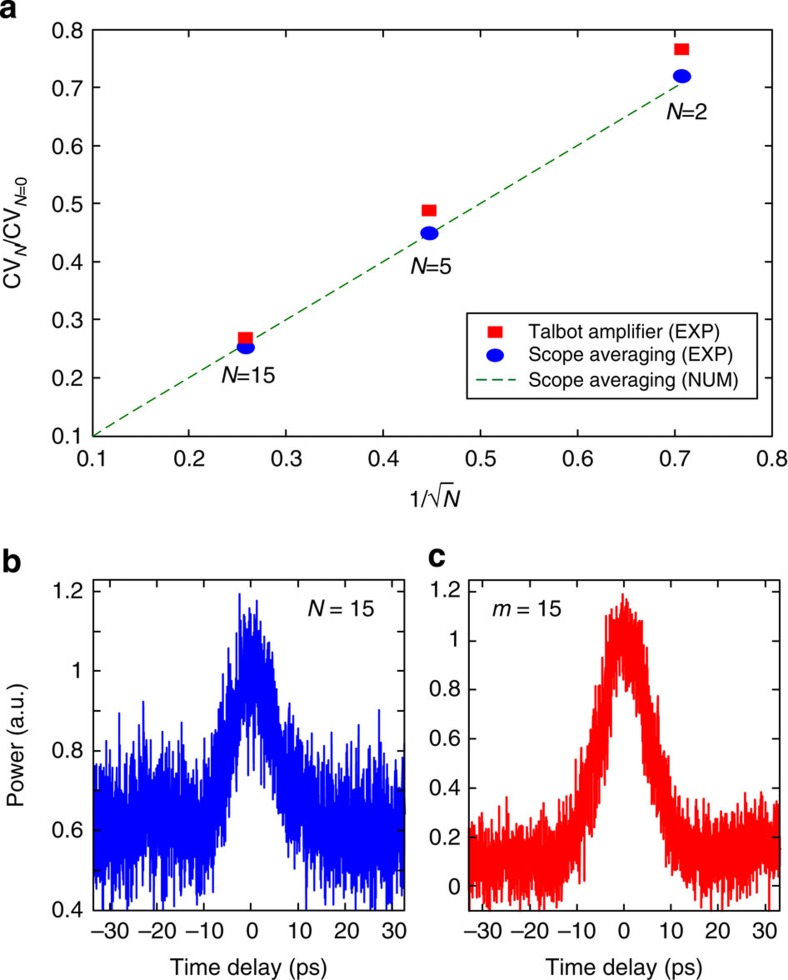
Figure 8. Averaging effect of Talbot amplification for ASE-like noisy fluctuations.
(a) Red squares show experimental data for the coefficient of variance (CV) of a passively amplified noisy pulse (OSNR=10) for a given passive amplification factor m versus the inverse of the square root of the amplification factor m with no scope averaging; solid blue circles show experimental data for the CV of the same noisy input pulse (OSNR=10) for N scope averages and no passive amplification versus the inverse of the square root of the number of scope averages N; the dashed green line shows the expected (N)1/2 dependence of averaging governed by Poisson statistics. (b) Experimental sampling oscilloscope trace for a pulse without passive amplification using scope averages, N=15. (c) Experimental sampling oscilloscope trace of the same pulse train as in b, but using passive Talbot amplification with m=15 and no scope averaging.

