
Figure 1.
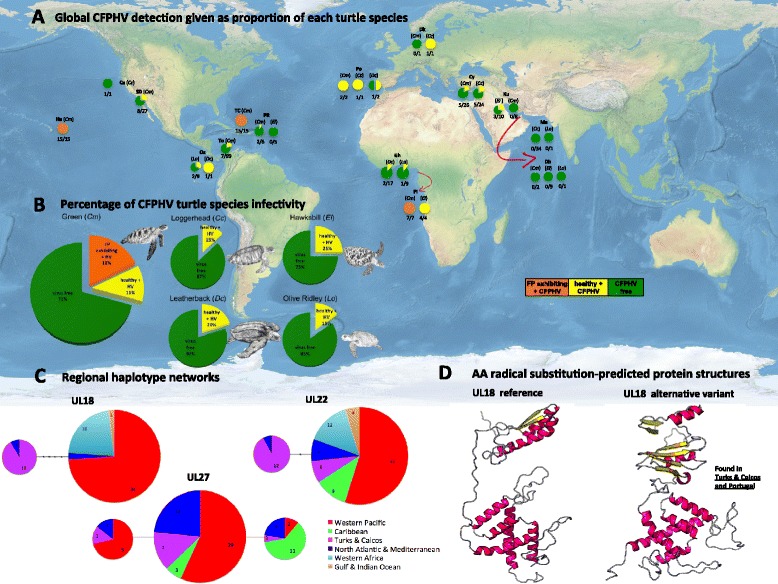
CFPHV global detection, haplotype networks and AA protein structures. (A) Global CFPHV detection given as proportion of each turtle species’ populations. Different colours represent category of tissue sample and infectivity status as follows; Orange = FP exhibiting turtles found CFPHV positive, Yellow = clinically healthy turtles also CFPHV positive, and Green = clinically healthy turtles CFPHV negative (CFPHV free), (B) Percentage of CFPHV turtle infectivity grouped by different turtle species (same colour code as panel A), (C) Regional haplotype networks for markers UL18, UL22 and UL27 clustered by regional sample origins, and showing the respective number of haplotypes found per marker, and (D) Amino acid radical substitution-predicted protein structure models for marker UL18, where globally distributed samples have the reference structure, while green turtles from Turks and Caicos, plus one green turtle from Portugal correspond to the alternative variant structure.