
Figure 1.
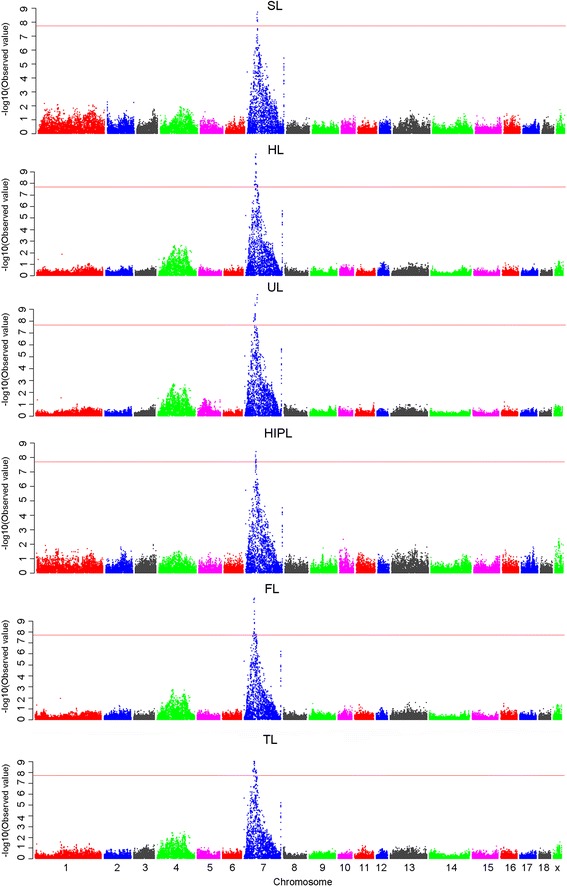
Manhattan plots of genome-wide association study with lengths of six limb bones. Chromosomes 1-18, X and Y are shown in different colors. The red horizontal line indicates the genome-wide significance level (-log10 (2.07E-08)).
Official websites use .gov
A
.gov website belongs to an official
government organization in the United States.
Secure .gov websites use HTTPS
A lock (
) or https:// means you've safely
connected to the .gov website. Share sensitive
information only on official, secure websites.
Manhattan plots of genome-wide association study with lengths of six limb bones. Chromosomes 1-18, X and Y are shown in different colors. The red horizontal line indicates the genome-wide significance level (-log10 (2.07E-08)).