
Figure 2.
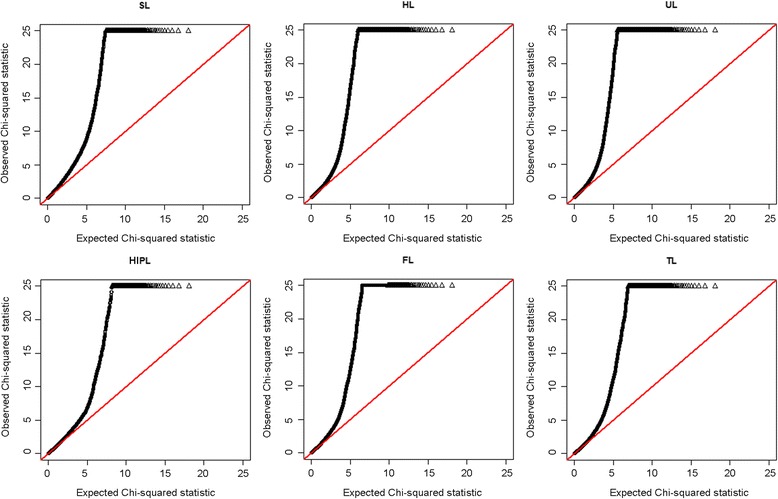
Quantile-quantile (Q-Q) plots. Results are shown in black. SNPs for which the test statistic exceeds 25 are represented by triangles.
Official websites use .gov
A
.gov website belongs to an official
government organization in the United States.
Secure .gov websites use HTTPS
A lock (
) or https:// means you've safely
connected to the .gov website. Share sensitive
information only on official, secure websites.
Quantile-quantile (Q-Q) plots. Results are shown in black. SNPs for which the test statistic exceeds 25 are represented by triangles.