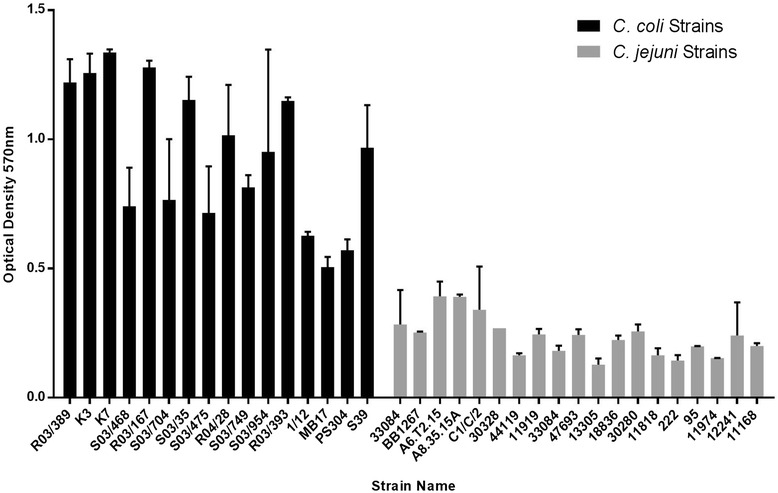
Figure 2.

Histogram representing propionic utilisation by C. jejuni and C. coli strains. The C. jejuni strains have been grouped together in grey bars while all C. coli strains have been grouped by black bars. No or only weak propionic utilisation was seen in all C. jejuni strains tested (values below an OD of 0.4) while high propionic utilisation was seen for all C. coli strains tested (values above an OD of 0.5).
