Figure 6.

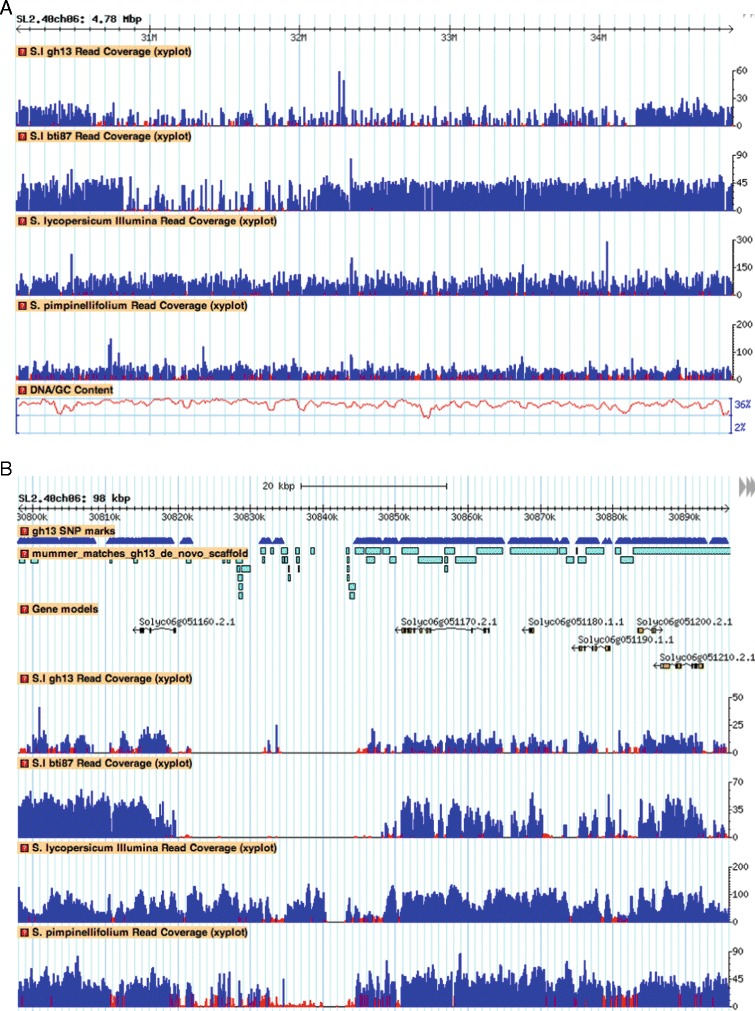
Genome regions of the Ty-3 introgression in lines Gh13 and BTI-87. A) Genome coverage plot of the chromosome 6 introgression (Gh13 and BTI-87). B) Zooming in an 80-Kb region from Figure 5A, spanning the Ty-3 region.

Genome regions of the Ty-3 introgression in lines Gh13 and BTI-87. A) Genome coverage plot of the chromosome 6 introgression (Gh13 and BTI-87). B) Zooming in an 80-Kb region from Figure 5A, spanning the Ty-3 region.