. 2014 Oct 25;14:417. doi: 10.1186/1472-6882-14-417
© Kjellgren and Westman; licensee BioMed Central Ltd. 2014
This article is published under license to BioMed Central Ltd. This is an Open Access article distributed under the terms of the Creative Commons Attribution License (http://creativecommons.org/licenses/by/2.0), which permits unrestricted use, distribution, and reproduction in any medium, provided the original work is properly credited.
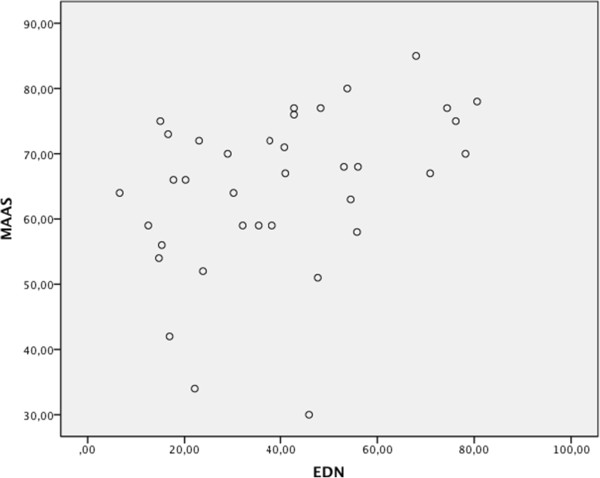
Figure 1.

Scatterplot for MAAS vs EDN.
