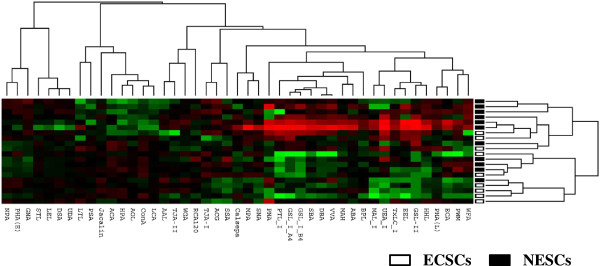
Figure 1.

Unsupervised hierarchical clustering of ECSCs and NESCs. ECSCs (n = 9) and NESCs (n = 11) were clustered according to the glycan expression profiles with 45 lectin probes that meet the filtering criteria. Unsupervised hierarchical clustering analysis of these 45 lectins showed that the patterns of glycan expression in ECSCs were similar to those in NESCs as a whole, suggesting that diseased tissues in endometriosis retain the characteristics of their origin, namely the eutopic endometrium, concerning glycan expression profiles.
