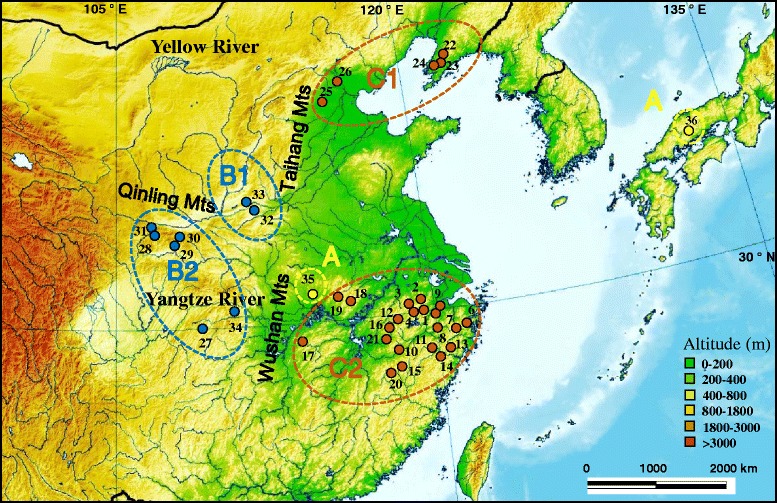
Figure 1.

Map of sampling localities for R . oxycephalus populations. The map was downloaded from the Wikimedia Commons on May 10, 2014 and slightly modified [26]. The locality numbers are given in Tables 1 and Additional file 1: Table S1. The matrilines are labeled yellow, blue, and brown for matrilines A, B, and C, respectively.
