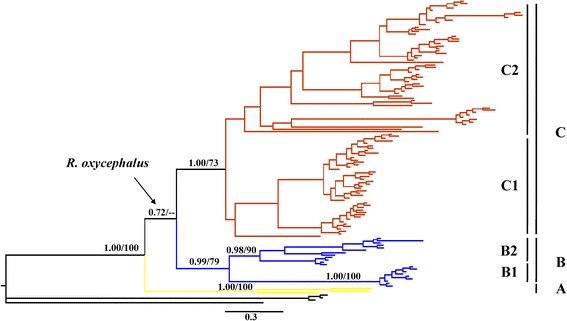
Figure 2.

R . oxycephalus maternal genealogy from Bayesian inference analysis. Numbers above branches are Bayesian posterior probabilities and bootstrap values from the maximum likelihood analysis, which are only shown for major and minor matrilines. The three major matrilines are identified by different colors (yellow, matriline A; blue, matriline B; and brown, matriline C).
