Figure 4.

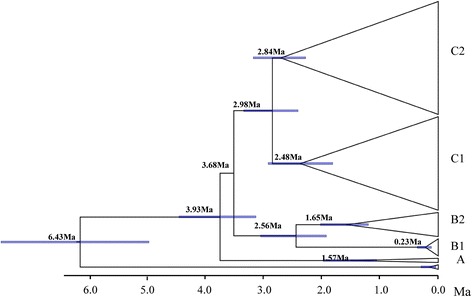
Divergence time tree for R . oxycephalus. Branch lengths are proportional to divergence times. Bars on the nodes are 95% confidence intervals. Matrilines A, B1, B2, and C1, C2 correspond to those in Figure 2.

Divergence time tree for R . oxycephalus. Branch lengths are proportional to divergence times. Bars on the nodes are 95% confidence intervals. Matrilines A, B1, B2, and C1, C2 correspond to those in Figure 2.