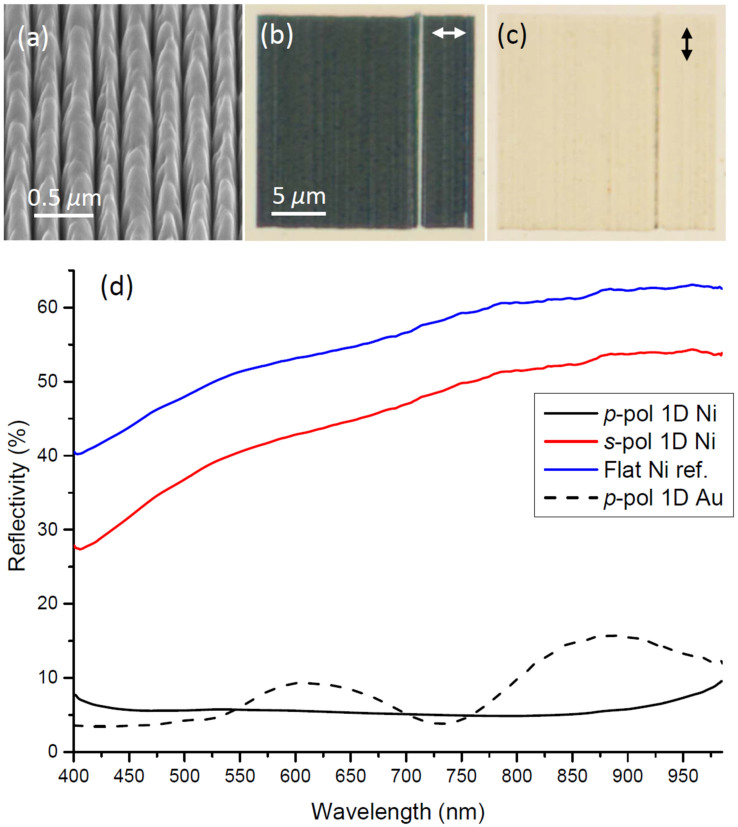
Figure 1.
(a) SEM image of 1D black nickel taken at 54 deg., along with (b)–(c) optical microscopy images obtained for the incident electric field polarization directions indicated by arrows, and (d) corresponding reflectivity spectra including a flat nickel reference and 1D black gold for comparison (Supplementary Fig. S1).

