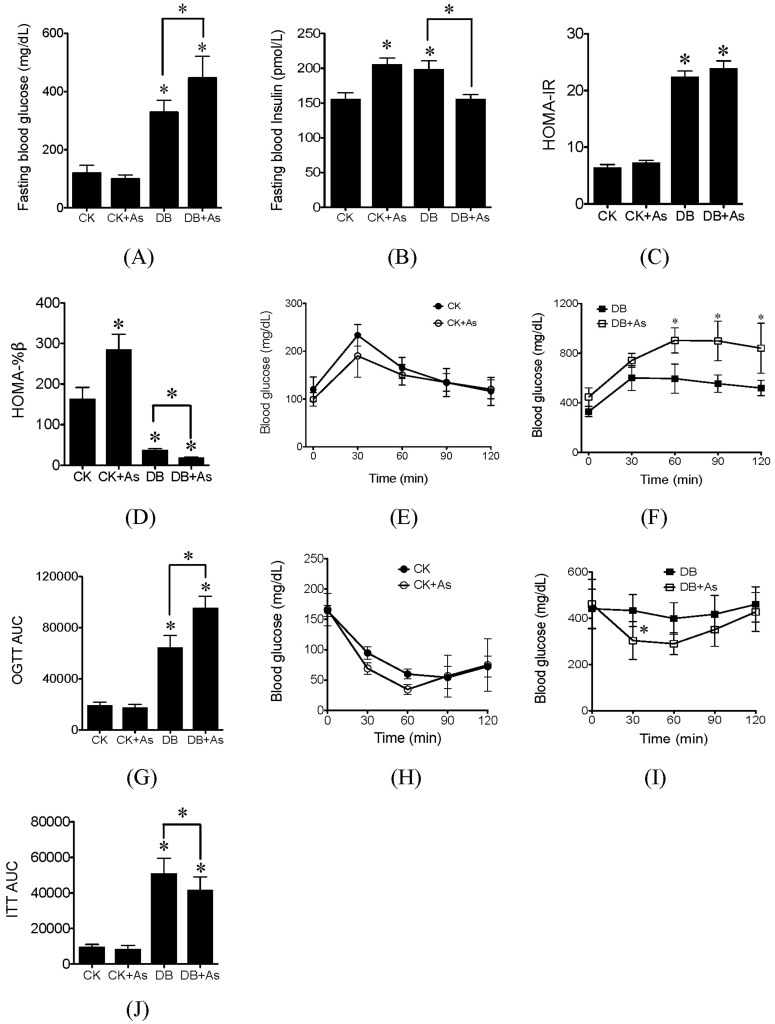
Figure 3. Effects of arsenic exposure on blood glucose and insulin tolerance.
(A) Fasting blood glucose; (B) Fasting blood insulin; (C) HOMA-IR; (D) HOMA-%β; (E) and (F) OGTT; (G) OGTT AUC, calculated according to OGTT; (H) and (I) ITT; (J) ITT AUC, calculated according to ITT. CK means control mice. DB means diabetic mice. Values are mean values ± standard deviation (n = 7–8). Differences of results among groups were calculated using ANOVA followed by Tukey's post hoc test. In general, * means significant difference (p<0.05) compared to db/m control mice or between special groups. In (F) and (I), * means significant difference (p<0.05) compared to db/db control mice at the same time.

