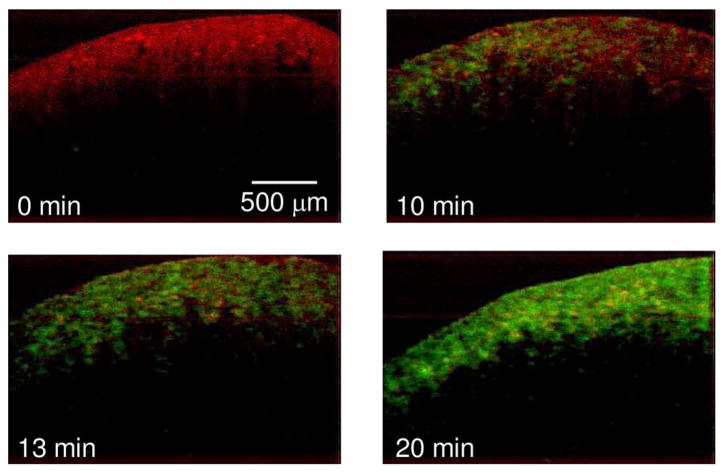
Fig. 4.
MM-OCT images of lung tissue acquired at intervals of 0, 10, 13, and 20 min after immersion in the MNP solution. The MM-OCT signal is shown, superimposed over the structural OCT signal. (Appear in color online with green channel representing MM-OCT signal and red channel representing OCT signal.)

